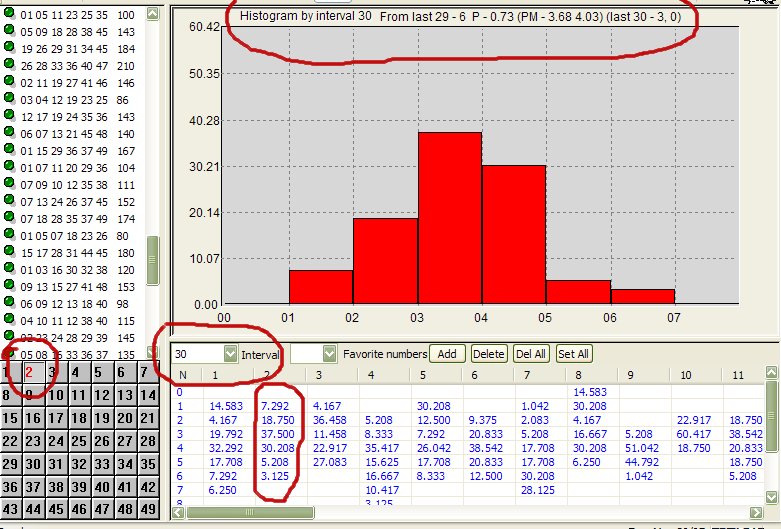
Here we can see histogram for number 2 and interval 30. We see, that number 2 for any 30 draws appeared from 1 up to 6 times Also we see, that more often number appeared 3 or 4 times (37.5% and 30.0%) Also it is known, that for the last 29 times number appeared 6 times. It means, that if the number to appear in next draw that for the last 30 draws it will be drawn 7 times. Using the given information, I try to count probability of such event. In this example the probability is P - 0.73. Also you can see two values for PM (PM means the most expected value). First value (in our case this is 3.68 ) is the PM for all period of draws and next one - 4.03 is PM for the last 60 draws (Interval (30)+last(30) )